Posts

VP9 Video Encoding/Decoding Support On A PC
Image
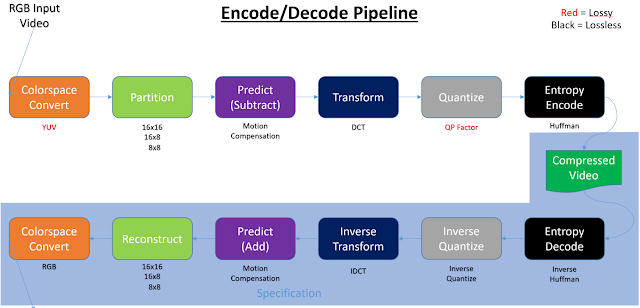
Introduction Video decoding/encoding can take place in the following four types of silicon: 1. General purpose CPU silicon (x86, ARM, SSE, AVX, …) 2. Dedicated CPU silicon (Intel QuickSync, AMD VideoCoreNext) 3. General purpose GPU silicon (cores) (GPGPU, Cuda, OpenCL, Shaders, …) 4. Dedicated GPU silicon (NVidia PureVideo (decode), NVida NVENC (encode)) (Table 1) When video is encoded or decoded any combination of the above silicon can be used. Being this paper is focused on everyday PCs, I’ve left out things like FPGAs, but you could consider an FPGA solution to be more like a general purpose GPU silicon solution. Note, at times this paper uses the term SIP (Semiconductor Intellectual Property core) to denote dedicated encode/decode silicon. Encoding and decoding of video has a defined pipeline: When encoding or decoding video, any one of those colored blocks can be done in hardware or software.   Sometimes a full software approach is ...

Linux: Recursively delete files that match a pattern or filename using 'find'

find . -name "*.bak" -type f -delete But use it with precaution. Run first: find . -name "*.bak" -type f

Emscripten debug flags

em++ -O0 -g4 hello_world.cpp -o hello.html --emrun -s SIMPLIFY_IFS=0 -s ASSERTIONS=2 -s SAFE_HEAP=1 -s STACK_OVERFLOW_CHECK=2 -s DEMANGLE_SUPPORT=1 -s DISABLE_EXCEPTION_CATCHING=0 -s EXPORT_ALL=1 -s EXPORT_BINDINGS=1 -s EXPORT_FUNCTION_TABLES=1 --source-map-base http://localhost:6931/

Classes From XML Schema

This is the CMD to generate the classes from the schema SET XsdPath=C:\Program Files (x86)\Microsoft SDKs\Windows\v8.0A\bin\NETFX 4.0 Tools "%XsdPath%\xsd.exe" YOUR-SCHEMA1.xsd YOUR-SCHEMA1.xsd /classes /namespace:YOUR-NAME-SPACE This is the reference:  https://msdn.microsoft.com/en-us/library/x6c1kb0s(v=vs.110).aspx Another good example:  https://blogs.msdn.microsoft.com/yojoshi/2011/05/14/auto-generating-entity-classes-with-xsd-exe-for-xml-serialization-and-de-serialization/ Then for mapping the class you can use:  https://github.com/AutoMapper/AutoMapper You can install it as a nuget package

How To Attach To A C# Process

{ System.Diagnostics.Debug.Assert(System.Diagnostics.Debugger.IsAttached); ... } You can now attach and then hit Ignore on the assert popup dialog.

How To Get OutputDebugString() Working In 64 Bit Windows

Basically you need to enable  NATIVE  code debugging at the managed code level and you need to enable  MIXED  debugging at the non-managed level. 1. Thor or TJMTestApp, Properties->Debug, Enable native code debugging. 2. Transcoder Engine, Properties->Debugging, change Debugger Type from Auto to Mixed. Auto chooses Managed. Stupid Microsoft. 3. (Optional) Tools->Options->Debugging->General, change "Redirect all Output window text to the Immediate window" to what you want. http://stackoverflow.com/questions/8234560/outputdebugstring-does-not-work-on-windows-7x64 http://stackoverflow.com/questions/9431253/outputdebugstring-doesnt-print-information-in-visual-studio-2010

GraphStudioNext Analyzer Filter

Image
This filter from GraphStudioNext's GitHub site ( https://github.com/cplussharp/graph-studio-next ) allows you to sniff media samples passed between filters. The filter is named GsnAnalyzer64.dll and can be found at  \\ la1pvarccifs.d3nw.net \Operations\Vault\Mike\graph_studio_next_helper_filters To use the filter just insert it between other filters.  You will then sniff the media samples passed between them. Open the properties of the GraphStudioNext Analyzer Filter and you will see the samples.  It does not auto-populate, you have to click on the Refresh button.